Back to Portfolio

Market Rotation Analysis

Interactive analysis of 500+ stocks across sectors, industries, and themes using Relative Rotation Graph methodology

Interactive Charts

Sector Rotation

Who's Leading?

Track broad market rotation across major sectors. Identify which sectors are gaining or losing momentum relative to the market benchmark.

View Interactive Chart

Industry Deep Dive

Industries in Motion

Granular analysis of industry-level rotation. Discover emerging trends and rotation patterns at the industry level.

View Interactive Chart

Sub-Industry Signals

Granular Intelligence

Deep dive into sub-industry rotation patterns. Identify specific pockets of strength and weakness in the market.

View Interactive Chart

Thematic Trends

Custom Factor Analysis

Rotation analysis based on custom thematic classifications. Track momentum across investment themes and market narratives.

View Interactive Chart

How does this work?

The analysis transforms raw market data into rotation signals through a 4-step pipeline:
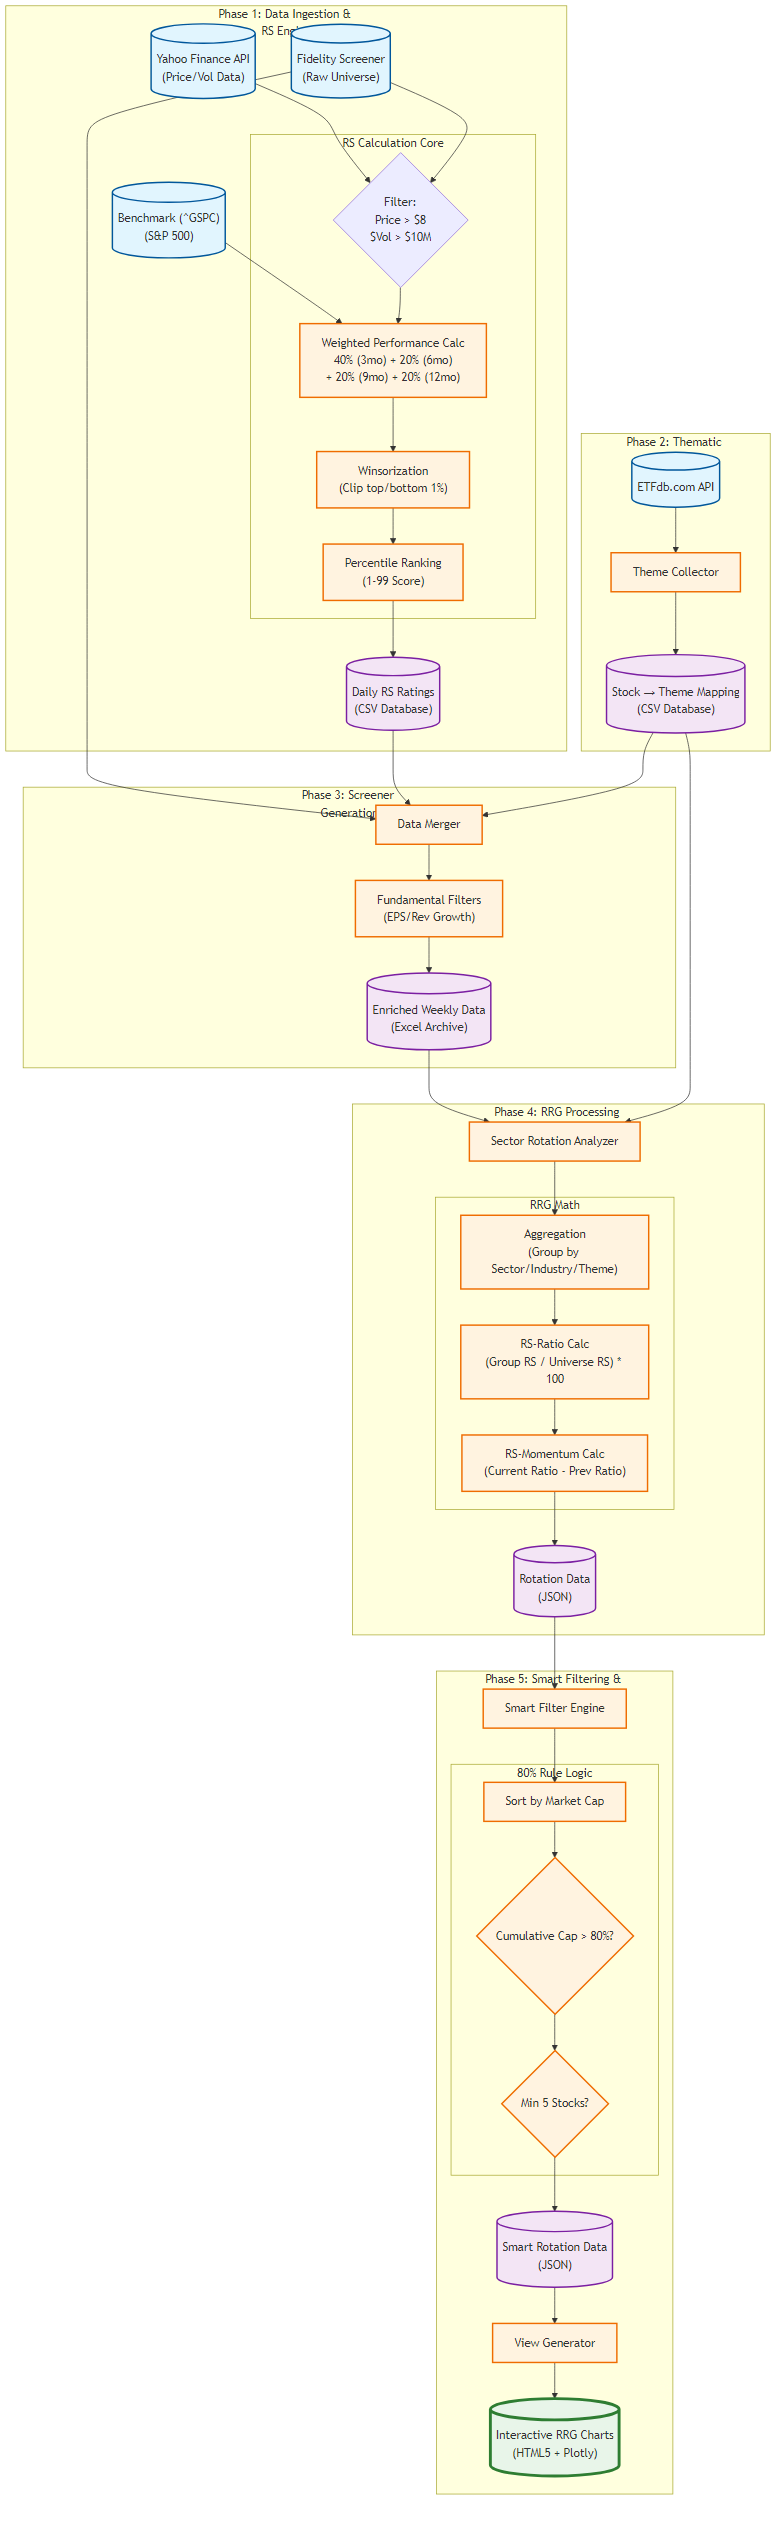
1

Data & Scoring

500+ stocks analyzed weekly for relative strength (RS Rating 0-100)

2

Smart Filtering

Significance-based filtering tracks important groups across time

3

RRG Calculation

Calculate RS-Ratio (vs market) and RS-Momentum (rate of change)

4

Visualization

Interactive Plotly charts showing rotation across 4 quadrants

Understanding the Quadrants

  • Leading: Strong & Getting Stronger
  • Weakening: Strong but Slowing Down
  • Lagging: Weak & Getting Weaker
  • Improving: Weak but Waking Up

Find This Useful?

If these visualizations helped you, consider supporting my work!

Buy Me a Coffee

Interested in the methodology, data pipeline, or source code? Let's connect →